NOOSA RIVER WATER TESTS AFTER MORE FLOODS
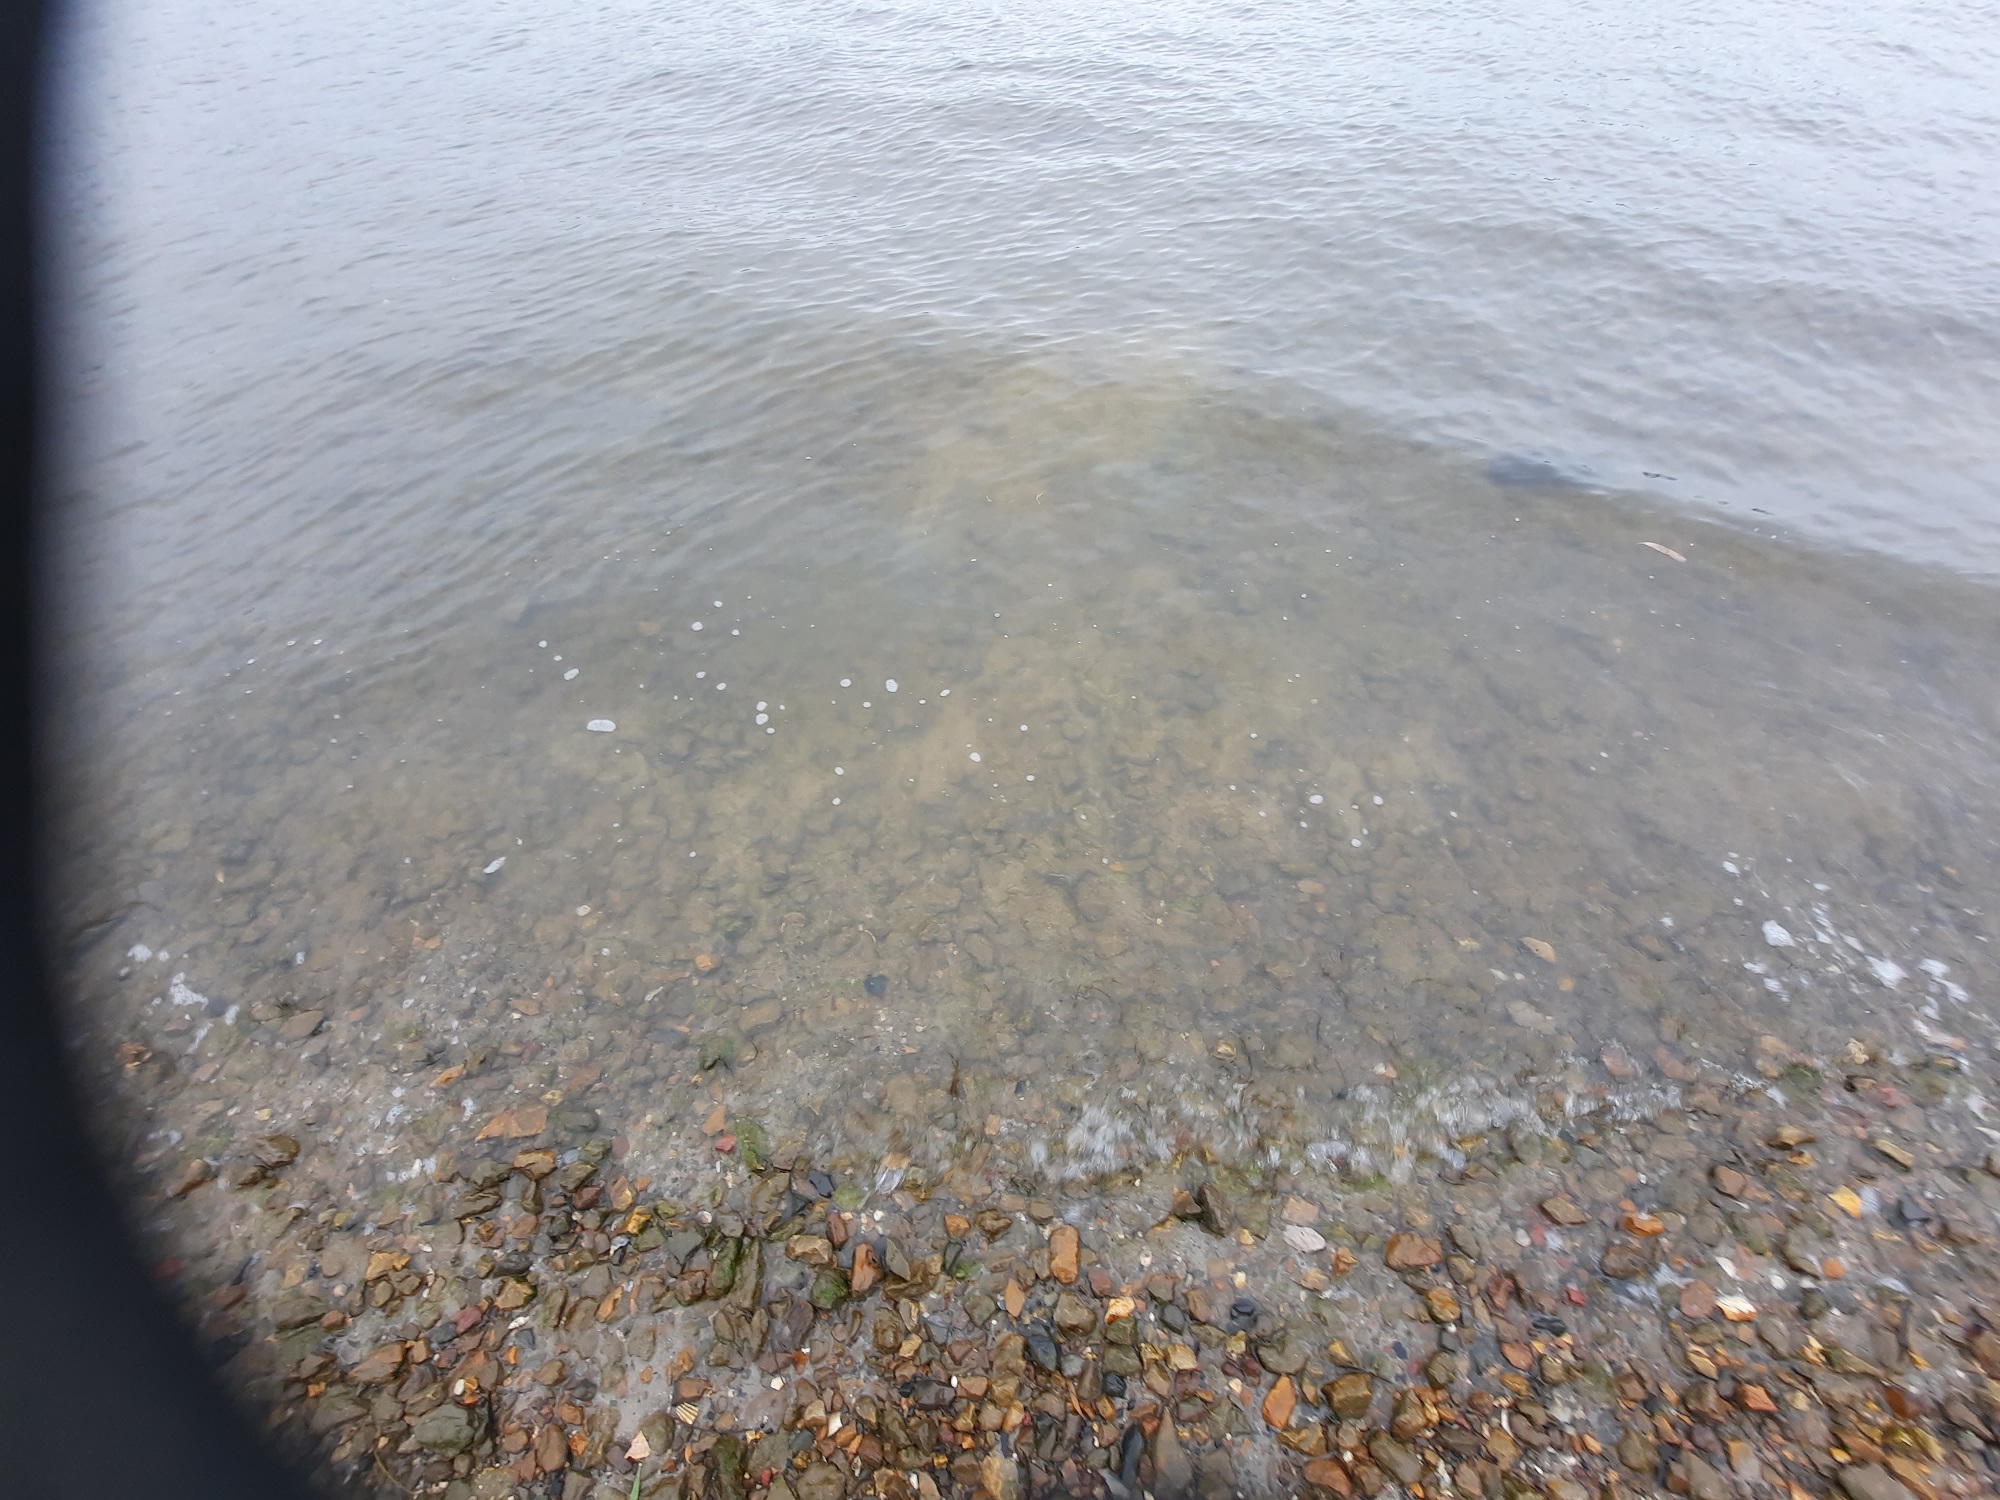
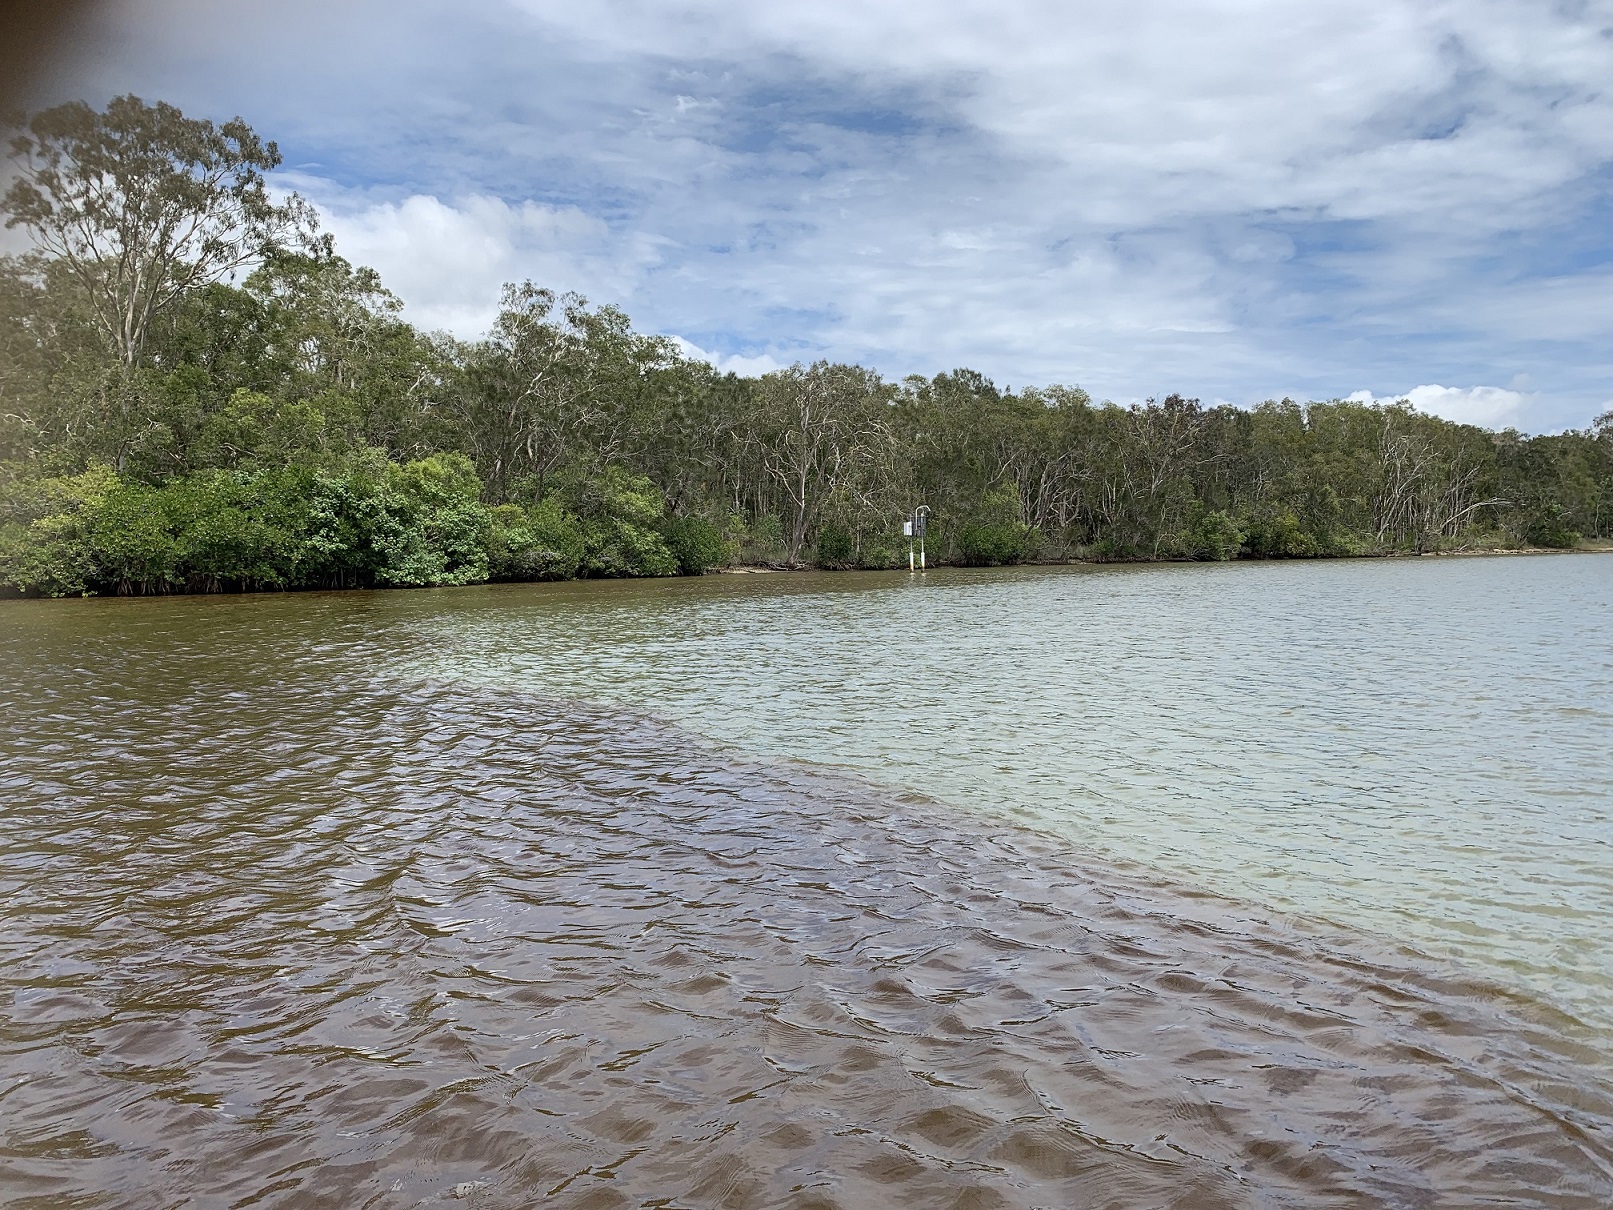
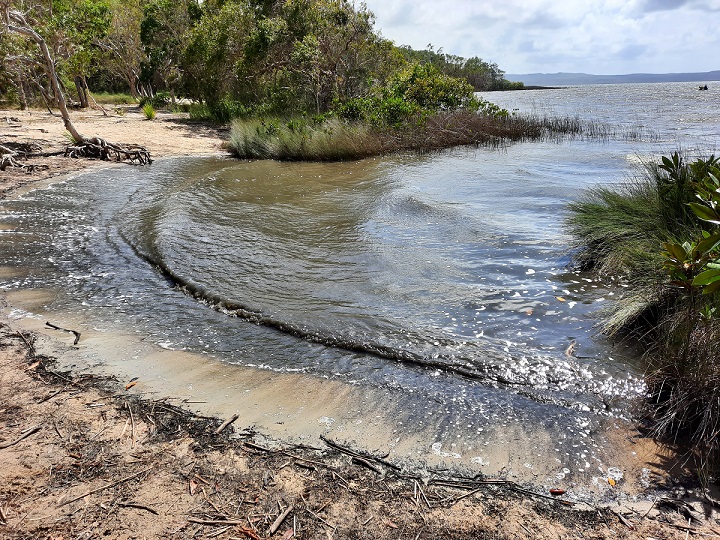
To the surprise of everyone we continued to receive heavy rain during May, 643 mm at Tewantin and 500 mm at Boreen Point, which then tapered off with only just over 100 mm during June. There was resulting high turbidity throughout the river again during May, but it had returned to more usual levels by the end of June. However the river still has retained a quite cloudy appearance despite the low Turbidity readings, and its cloudy brown colour is carried right out into the ocean.
Chemical tests for nutrient residues have shown similar patterns due to the rainfall. Nitrates have all risen sharply in May following the heavy rain and have dropped back to normal levels during June. The nutrients are associated with the sediments as well as being dissolved in the water.
The apparent inconsistency between appearance and turbidity measurements is curious, and may reflect differences in the solid particles suspended in the water at different times. Particle size, shape, and colour can all modify the distribution of scattered light in the turbidity sensor, therefore these variations can introduce wide variation in the measurement of turbidity. Previous studies have established variations in the size of sediment particles in Lake Cootharaba, with clay and silt particles smaller than 50 µm readily remaining in suspension and flowing downstream. As much as 10% of the lakebed sediments have been measured as smaller than 2 µm which, being not much larger than white light wavelengths (0.5 – 0.7 µm), might not scatter light very much and so reduce the sensitivity of the Turbidity meter to very fine sediments. These fine sediments can continue to flow, while coarser ones will settle to the bottom more quickly.
After the wild variations we’ve seen this year I’m now coming to regard turbidity as the main indicator of river water quality, certainly it’s the most easily recognisable indicator to the average observer. To most people, turbidity correlates to cleanliness. I’m wondering whether we might just propose a simple water quality rating on a 1 to 5 scale,
- Clear water – That’s Good

- Clear but brown -Well….OK (the brown is actually soluble tannin from natural leaf decay)

- Brown but getting cloudy – Suspect — don’t let the kids put their heads under

- Brown and opaque – Terrible, phone council to complain about sewage discharge and toxic crabs

- Really filthy – Never go near there again
Bruce McConkey, Vol Project Coordinator


